Current Projects
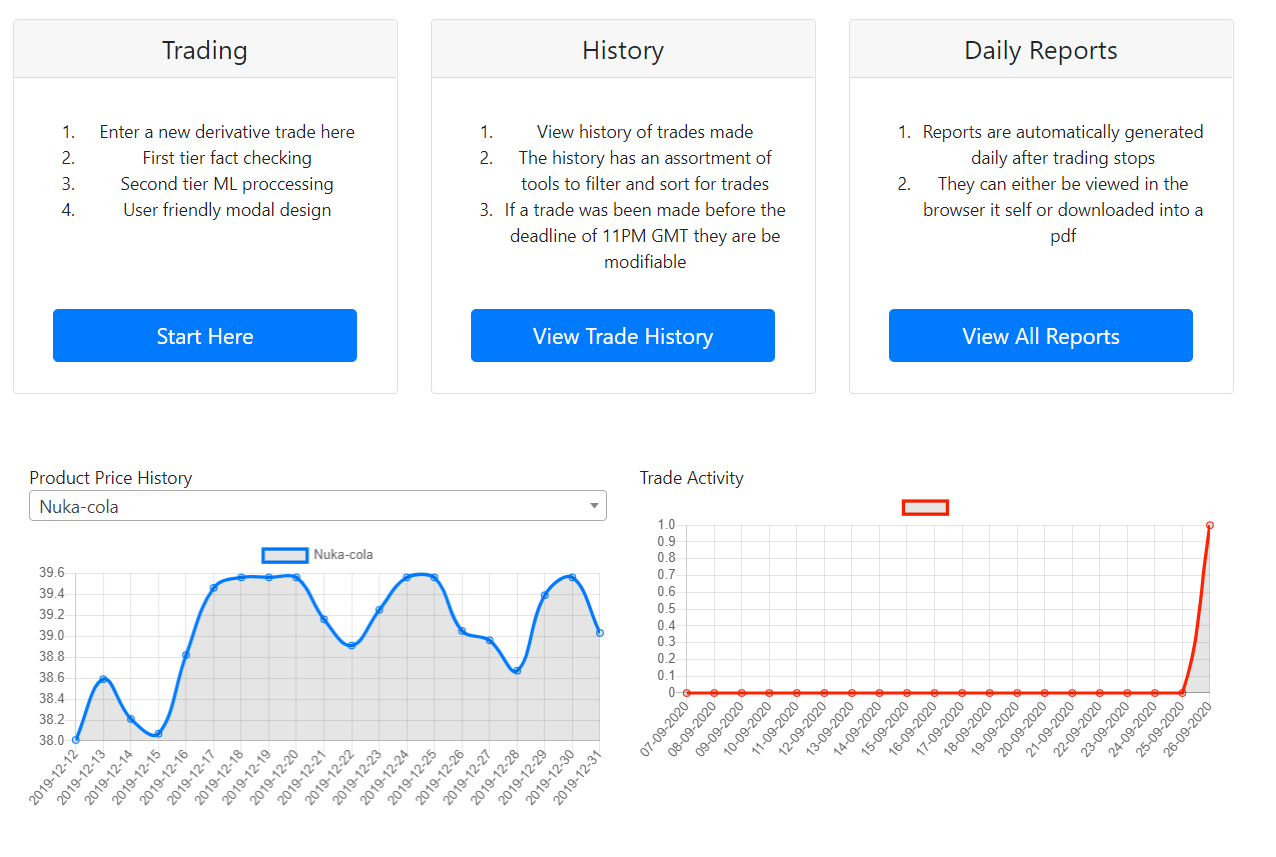
QueueTube
Essentially a hugh 'watch later playlist' with time stamp saving and channel prioritization. Created for my compulsion to watch ALL the videos in my subscription feed in the order they were released, without missing one. Due to GDPR, it is currently only open to me and friends. Contact me if you want Beta access. A Demo account will be created soon for trial use.
Computer vision based head tracking
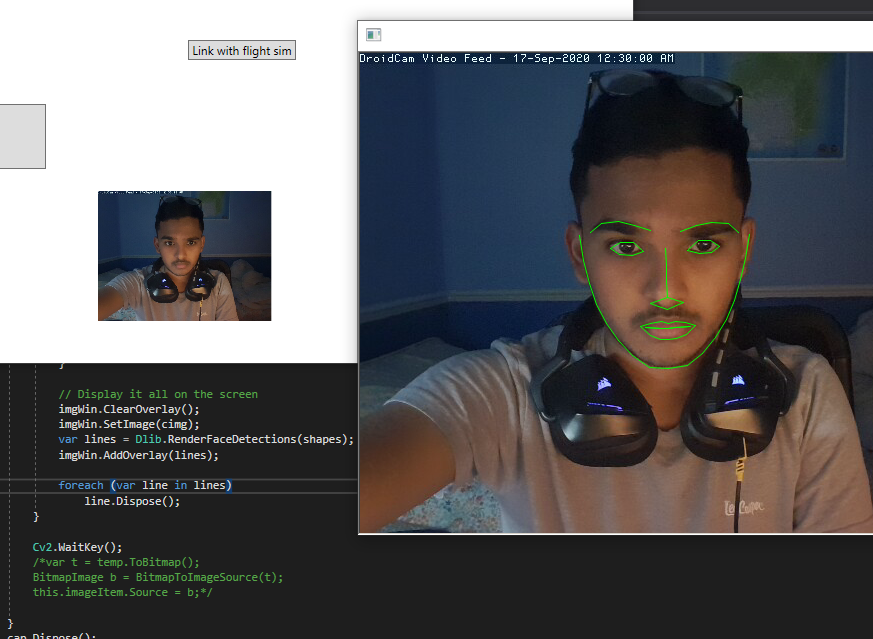
A free open source head tracking solution using only image data from webcam. Image processing using OpenCV and DLib for facial landmark model. GUI built using .NET and WPF. The resulting data is send to OpenTrack via a UDP socket, which is then translated to head movement in game.
Virtual reality learning environment
(Currently working on)
Frame Label
Developed during work for iCuris. I needed a simple software to quickly label image sets for training my neural network model. There exists solutions for single frame labeling such as Microsoft's solution but I needed one for working with specifically groups of images. The app is currently prototyped using the Python library TKinter and specifically built for dealing with the datasets used in my work at iCuris. I hope I am able to extend to variable input and output method.
Cannot release details until the project is ready.
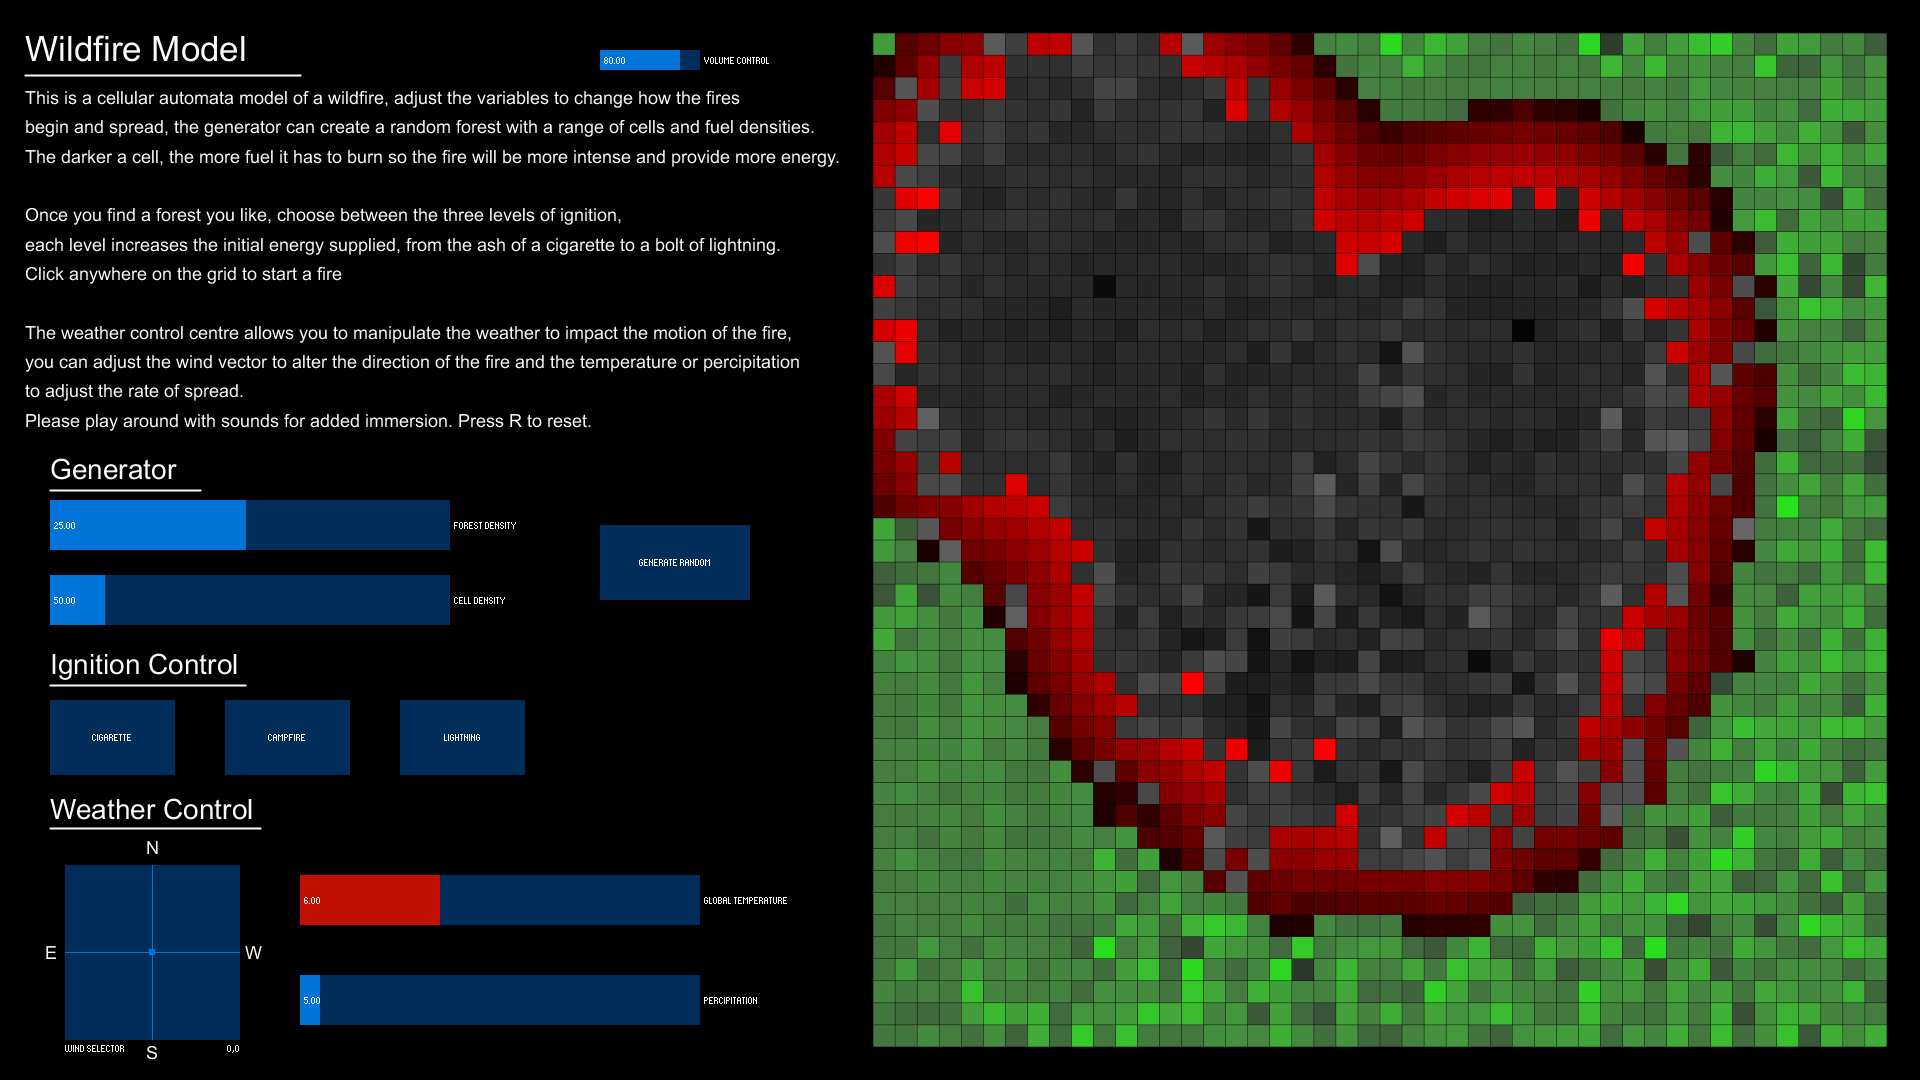
Visualization - Cellular Automata: Wildfire simulation
Visualization course work, using a 5x5 Moore neighborhood, cellular automata model of a wildfire. With complete user control of fuel density, forest size, ignition scale, weather direction and magnitude, temperature and precipitation. Written in Processing. Code and its respective report can be send on a request basis.
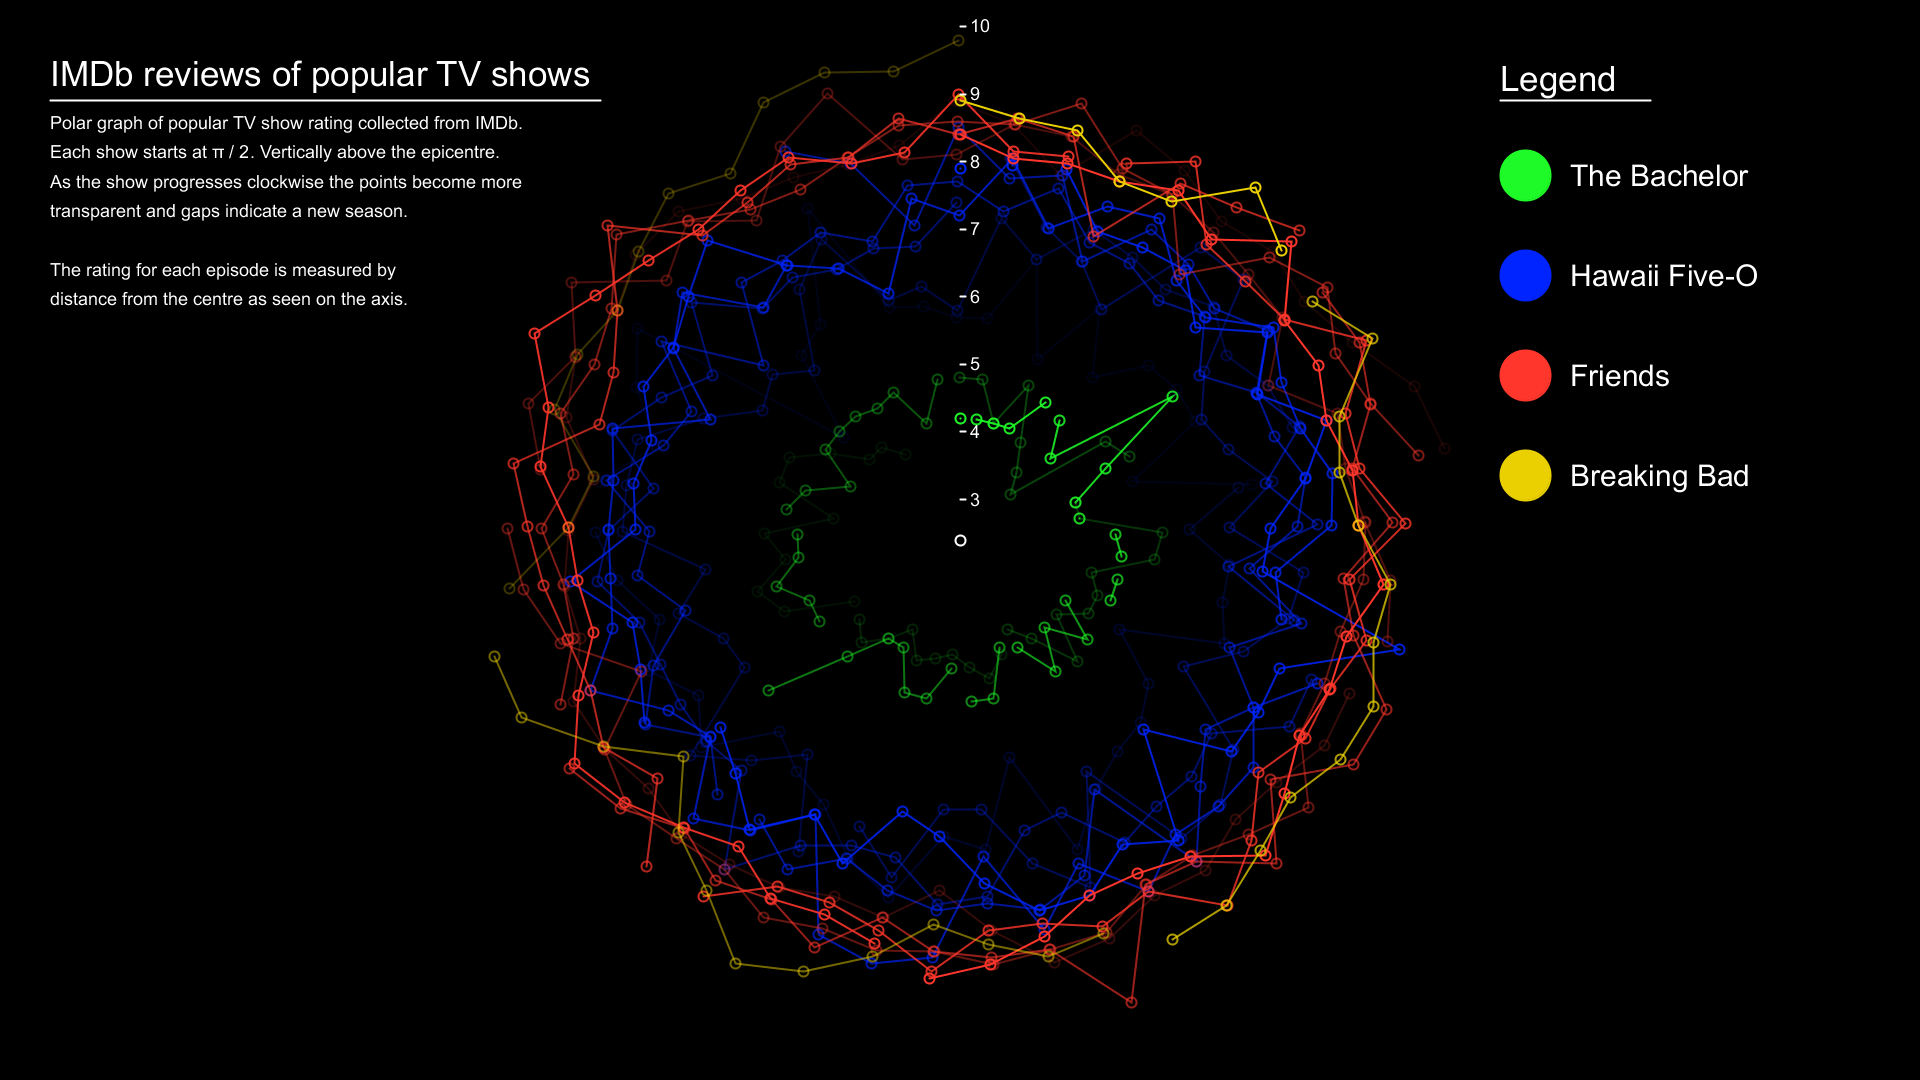
Visualization - TV show ratings over time Polar graph
Visualization course work, an interactive model of the IMDb ratings of a selection of TV shows, the model can be rotated and manipulated to compare the relative success throughout a shows lifetime. Written in Processing. Code and its respective report can be send on a request basis.
